Motion in a Straight Line – Graphs Related to Motion: NEET MCQs with Answers
15 free questions on Motion in a Straight Line – Graphs Related to Motion for NEET (UG), starting with previous-year NEET and AIPMT questions. Try each one, then tap Show answer for the answer and a short explanation.
Syllabus covered: Graphs Related to Motion: Position–time graph, Velocity–time graph, Acceleration–time graph (recommended to include)
Question 1
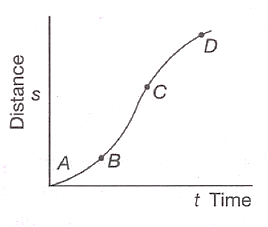
Previous-year questionA particle's distance-time curve is shown. The maximum instantaneous velocity of the particle is around the point [AIPMT 2008]
- D
- A
- B
- C
Show answer
Answer: (D) C
Explanation: Instantaneous velocity is the slope of the distance-time curve. The curve is steepest around point C. The slope is small near A and B and has decreased again by D.
Question 2
Previous-year questionWhich of the following curves does not represent motion in one dimension? [AIPMT 1992]
- Diagram A
- Diagram B
- Diagram C
- Diagram D
Show answer
Answer: (C) Diagram C
Explanation: A particle in one-dimensional motion can have only one velocity at any instant, so velocity must be a single-valued function of time. On a v–t graph, any vertical line may therefore cut the curve at only one point. The closed circle fails this test: for one value of t it gives two different values of v, which would mean the particle has two velocities at the same instant. That is impossible. It would also need time to run backwards along part of the loop. The triangular graph, the rising curve and the sine-like curve each give a single velocity at every instant, so all of them are acceptable. In the sine-like curve the velocity simply reverses direction periodically.
Question 3
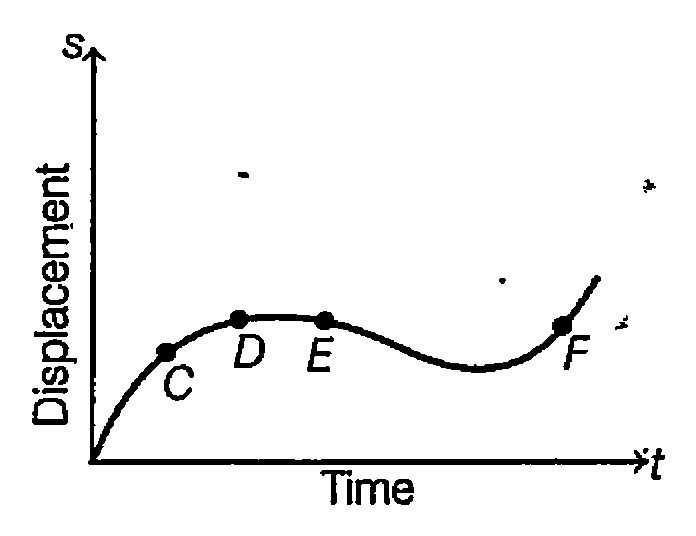
Previous-year questionThe displacement–time graph of a moving particle is shown in the figure below. The instantaneous velocity of the particle is negative at the point [AIPMT 1994]
- D
- F
- C
- E
Show answer
Answer: (D) E
Explanation: Instantaneous velocity is the slope of the displacement–time graph. It is negative wherever the curve is falling, i.e. where displacement is decreasing with time. Of the four marked points, the curve is clearly descending only at E, so the slope — and hence the instantaneous velocity — is negative there. At C the curve is rising, so the velocity is positive; at D the curve is near a local maximum, where the slope is approximately zero; and at F the curve is rising steeply again, giving a positive velocity.
Question 4
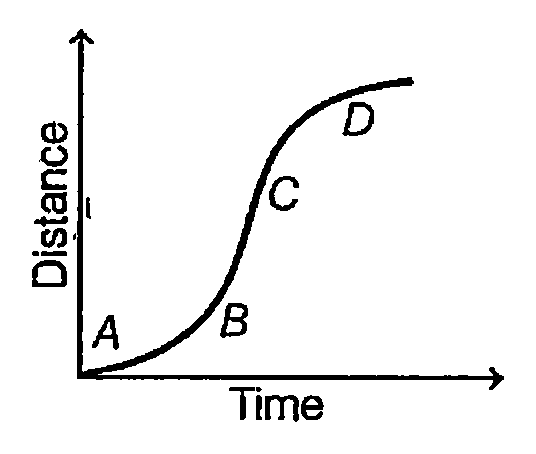
Previous-year questionA particle shows the distance–time curve given in the figure below. The maximum instantaneous velocity of the particle is around the point [AIPMT 2008]
- B
- C
- D
- A
Show answer
Answer: (B) C
Explanation: The instantaneous velocity at any instant is the slope of the tangent drawn to the distance–time curve at that instant, v = dx/dt. The velocity is therefore greatest where the curve is steepest. Reading the graph, the curve rises gently near A and B, becomes steepest around C, and then flattens out again towards D. Hence the maximum instantaneous velocity occurs around the point C. Recall the general shapes: a horizontal line means the object is at rest, a straight sloping line means uniform velocity, and a curve means the velocity is changing.
Question 5
Previous-year questionThe speed(s)-time(t) graph of a car is a straight line rising from (0,0) to (8,20). The distance travelled by the car in 8 seconds is: [RE-NEET(UG) 2024]
- 60 m
- 80 m
- 18 m
- 180 m
Show answer
Answer: (B) 80 m
Explanation: Distance = area under the s-t (speed-time) graph = area of the triangle = ½ × base × height = ½ × 8 × 20 = 80 m.
Question 6
Previous-year questionWhich position-time (x-t) graph correctly represents motion with positive (increasing) acceleration? [NEET(UG) 2022]
- Curve bending upward, increasingly steep
- Curve flattening out, decreasingly steep
- Straight line
- Straight line, negative slope
Show answer
Answer: (A) Curve bending upward, increasingly steep
Explanation: Positive, increasing acceleration means the velocity (the slope of the x-t curve) keeps increasing — this appears as a curve that gets progressively steeper, i.e., concave upward throughout.
Question 7
Previous-year questionThe displacement–time graphs of two moving particles make angles of 30° and 45° with the x-axis as shown in the figure. The ratio of their respective velocities is [1990]
- √3 : 1
- 1 : 1
- 1 : 2
- 1 : √3
Show answer
Answer: (D) 1 : √3
Explanation: On a displacement–time graph the slope gives velocity: v ∝ tanθ. Ratio = tan30° : tan45° = (1/√3) : 1 = 1 : √3.
Doing well? Create a free account to take timed tests on this topic and see your weak areas.
Question 8
The position–time graph of a car moving on a straight road is a smooth curve that rises, reaches its highest point at t = t₀ and then falls. What is the instantaneous velocity of the car at t = t₀?
- Infinite
- Positive
- Zero
- Negative
Show answer
Answer: (C) Zero
Explanation: Instantaneous velocity is the slope of the tangent to the position–time curve. At the highest point of a smooth curve the tangent is horizontal, so the slope is zero. The car is momentarily at rest as it turns back.
Question 9
Which description of a position–time graph corresponds to motion with a positive acceleration?
- A curve whose slope keeps increasing with time, bending upward
- A straight line rising with a constant slope
- A curve whose slope keeps decreasing with time, bending downward
- A straight line falling with a constant slope
Show answer
Answer: (A) A curve whose slope keeps increasing with time, bending upward
Explanation: The slope of a position–time graph is the velocity. Positive acceleration means the velocity increases, so the slope must keep increasing and the curve bends upward. Straight lines show constant velocity and a downward-bending curve shows negative acceleration.
Question 10
A body moves along a straight line. Its velocity is +3 m/s for the first 2 s, −4 m/s for the next 1 s and +2 m/s for the following 3 s. What are the distance travelled and the displacement in these 6 s?
- 16 m and 16 m
- 8 m and 16 m
- 16 m and 8 m
- 12 m and 8 m
Show answer
Answer: (C) 16 m and 8 m
Explanation: The three stages give displacements of +6 m, −4 m and +6 m. Distance adds their sizes: 6 + 4 + 6 = 16 m. Displacement adds them with sign: 6 − 4 + 6 = 8 m.
Question 11
A body starts from rest. Its acceleration has a constant positive value from t = 0 to t₁, is zero from t₁ to t₂, and has the same positive value again after t₂. Which description fits its velocity–time graph?
- A horizontal line, then a rising line, then a horizontal line
- An upward-curving parabola throughout
- A rising straight line, then a horizontal line, then a rising straight line of the same slope
- A rising straight line, then a falling line to zero, then a rising line
Show answer
Answer: (C) A rising straight line, then a horizontal line, then a rising straight line of the same slope
Explanation: Constant positive acceleration makes velocity rise linearly, with slope equal to the acceleration. Zero acceleration keeps the velocity constant, giving a horizontal segment. When the same acceleration returns, the velocity again rises with the same slope.
Question 12
A particle starts from rest. Its acceleration rises uniformly from zero to 12 m/s² during the first 4 s and then stays at 12 m/s² until t = 8 s. What is its average acceleration over the first 8 s?
- 9 m/s²
- 12 m/s²
- 6 m/s²
- 10.5 m/s²
Show answer
Answer: (A) 9 m/s²
Explanation: The change in velocity equals the area under the acceleration–time graph. That area is ½ × 4 × 12 = 24 m/s for the first 4 s plus 4 × 12 = 48 m/s for the next 4 s, a total of 72 m/s. Average acceleration = 72/8 = 9 m/s².
Question 13
The total distance covered by a moving body is plotted against time. Which of the following shapes can NOT be such a distance–time graph?
- A line that rises for a while and then runs parallel to the time axis
- A straight line rising from the origin
- A curve rising more and more steeply from the origin
- A straight line falling steadily from a positive value towards the time axis
Show answer
Answer: (D) A straight line falling steadily from a positive value towards the time axis
Explanation: Distance travelled is a running total of path length, so it can stay the same or increase but can never decrease with time. A falling line would mean the distance covered gets smaller, which is impossible. The other shapes show uniform motion, accelerated motion and a body that stops.
Question 14
On a position–time graph, particle P is represented by a straight line that starts at x = 2 m and has a slope of 3 m/s, while particle Q is represented by a straight line that starts at x = 8 m and has a slope of 1 m/s. Which statement is correct?
- Both move with uniform velocity, and the velocity of P is greater than that of Q
- Both move with uniform velocity, and Q is faster because it starts ahead
- P is accelerating while Q is retarding
- Both move with uniform velocities of equal magnitude
Show answer
Answer: (A) Both move with uniform velocity, and the velocity of P is greater than that of Q
Explanation: A straight line on a position–time graph means constant velocity, equal to its slope. P has a slope of 3 m/s and Q a slope of 1 m/s, so P is faster. The starting position only shifts the line and does not affect the velocity.
Question 15
A particle moves along a straight line with velocity v = (12 − 2t) m/s, so its velocity–time graph is a straight line falling from 12 m/s at t = 0 to −12 m/s at t = 12 s. Which statement about the motion from t = 0 to t = 12 s is correct?
- The net displacement from 0 to 12 s is 36 m
- The particle never reverses its direction of motion
- The acceleration is positive from 0 to 6 s and negative from 6 s to 12 s
- The average speed from 0 to 6 s equals the average speed from 6 s to 12 s
Show answer
Answer: (D) The average speed from 0 to 6 s equals the average speed from 6 s to 12 s
Explanation: The slope of the graph is −2 m/s² throughout, so the acceleration never changes sign. The velocity becomes zero at t = 6 s and then turns negative, so the particle reverses. The areas from 0 to 6 s and from 6 s to 12 s are each 36 m in size but opposite in sign, giving zero net displacement and an average speed of 6 m/s in each half.
Want more Motion in a Straight Line – Graphs Related to Motion questions?
E-GYAN NIDHI has 100 questions on this topic and 63,000+ in total, all free: timed CBT tests, NEET marking and instant analysis.
Register free Free Sunday Mock TestMore topics in KINEMATICS
- Motion in a Straight Line – Terms Related to Motion MCQs
- Motion in a Straight Line – Kinematics Equations of Uniformly and Non-uniformly MCQs
- Motion in a Straight Line – Relative Motion in One Dimension MCQs
- Motion in a Plane – Vectors MCQs
- Motion in a Plane and Projectile Motion MCQs
- Motion in a Plane – Relative Velocity in Two Dimensions MCQs
- Motion in a Plane – Uniform Circular Motion MCQs